The content on this blog (L1 Stock Market Analysis) is provided as information only and should not be taken as investment advice. All site content, including advertisements, shall not be construed as a recommendation to buy or sell any security or financial instrument, or to participate in any particular trading or investment strategy. The ideas expressed on this site are solely the opinions of the author (L1) and are for entertainment purposes only. L1 is not a licensed investment adviser (advisor) or commodity trading adviser nor is licensed as such with any federal or state regulatory agency. L1 does not manage client assets in any way. Any investment decision that results in losses or gains made based on any information on this site is not the responsibility of L1. L1 may make statements about certain investment vehicles and strategies, but it is not to be taken as investment advice. L1 Stock Market Analysis is an educational blog, not an advisory or stock recommendation service. At times, L1 will analyze the technical structure (chart) of various stocks or financial markets, but he is in no way compensated by the companies he analyzes either in reports or daily commentaries. All examples are provided for educational purposes.
L1 Stock Market Analysis public blog site content may be reproduced or excerpted online, provided full attribution is given to L1 and the original article source is linked. Private, password protected content and information may not be shared, excerpted or reproduced in any fashion.


Good afternoon all. From my post this morning, /ES blew through both profit targets. Therefore, /ES is now trading in extensions. The first setup is on the chart. The 61.8% extension long is 3013.66. This level is very important…..as long as /ES stays above 3013.66, /ES will continue to rally. Should /ES break 3013.66, the first support level is 3008.50.
Bottom line…..3013.66 bullish above and additional weakness to a support level below.
LikeLike
new post
LikeLike
Houston, your cleared for central bank Launch. enjoy the ride
LikeLike
i would be happy to exit long on a spike up to 3025 now
LikeLike
took profit at 3017 es
will check it tomorrow
LikeLike
LikeLike
I took all profit at 20, thanks phil . 👍
LikeLike
good call Phill . Bulls are in full charge. never easy to short, but back to long. 3035 by tomorrow
LikeLike
thanks
SPX cash needs to go up faster if its a post triangle thrust
LikeLike
ie BLAST thru 3014 and blast thru the high
none of this grinding up stuff
LikeLike
yep, , but I believe Europe Central bankers are on deck tomorrow. should jack it up into the close based on that alone
LikeLike
if you went long premarket at 2999 es as suggested
….raise stop now from breakeven
and keep trailing
i dont want ANY pullbacks any more
LikeLike
straight up to new highs or bust
see ya !
LikeLike
LikeLike
LikeLike
Thanks phil👍Sold long from yesterday , came back in at 3005
LikeLike
🙂
LikeLike
https://invst.ly/beben
Yesterday’s rally made it to 618 target. subsequent retrace/rally terminated at the high and broke the bull. Now monitoring hourly closes https://invst.ly/bebg9
LikeLike
you’re welcome
LikeLike
Inflection point. 3006 was not over lapped yet. Until it does still bearish potential. I have no position. Will go long over 3007 cash. If we sell off, would be looking foe 2960 area for a long. I could see either case. Would also prefer a big sell off today to 2960, European banks tomorrow should juice the markets.
LikeLike
I’m now short. Market had 3 chances to push over 3008. Yesterday, last night in futures and the 1st 30 minutes at the open.. short leash. We shall see.
Good luck all
LikeLike
cave man wave count
LikeLike
Good morning all. The overnight session broke one 15 minute short setup but there are other anchors one can use as well. There are two long setups drawn on the chart. /ES appears to be testing and defending the 15 minute, 61.8% long setup at 2995.52…that’s bullish.
The second larger setup has the bull/bear 61.8% long line in the sand at 2984.40. As I mentioned in last nights post, bonds are rallying, which is bearish for equities. However, /VX had a counter trend rally up to a 50% short and is decline off that level….bullish for equities.
Bottom line ….
1. Conservative setup, /ES 2984.40 bullish above and bearish below.
2. Aggressive setup, /ES 2995.52 bullish above and additional weakness to a lower support level below.
3. From my post last night, if the aggressive setup fails, There are other 15 minute setups that /ES could rally off of before testing 2984.40. The point is, don’t think if 2995.52 breaks the next level to watch is 2984.40.
LikeLike
I do believe that “patience” is the call of the day.
Good Luck All
LikeLike
Lunker, if you don’t want this on the site…I understand. Not market related. Not intended to be political either…just something that astounds the daylights out of me; the city council of Berkley just banned natural gas starting in January. Say what???!!!???
LikeLike
You can be arrested for farting?
LikeLike
Still looks like a wave b bounce, short with stop at 3020 cash level
LikeLike
Agree rikki. Going forward we are likely to see a lot of very bouncy ‘abc’s.
LikeLike
Looks that way to me, too (so far). See my post on OEW site.
LikeLike
Add another bet here 3007. And that’s it for me.
=)
LikeLike
European fed tomorrow. Squeeze into the close gap up tomorrow. how hum. thank you central bankers
LikeLike
3020 close 3035 sometime tomorrow
LikeLike
3019.56 not 3020 but close enough. See what the reaction to data and central bankers in the morning. Cant imagine anything but a gap up to at least 3028 which is only 7.5 points away.
LikeLike
you would think that …wouldnt you ttmab ?
but this is where we were july 15
a few points from 28 es and then swoosh…………..
until 3028 is hit
risk is still down to 2950
LikeLike
Sox break out seems promising, personal trade losing 10 pts vs 30 to 50 downside is ok risk reward for me. Been long since 2800ish with spx and nasdaq, no harm losing a bit =)
LikeLike
Wanted to add 1 more bet at the end, but restrained. After all we are in a bull cycle. Dangerous to catch counter trend.
LikeLike
Just another way of looking at this (mess):
Good Luck All.
LikeLike
Great job Rick I’m a big fan of drawing properly shaped ellipses
LikeLike
Thanks Lunker. When I couldn’t count this last rally and, when asa and Phil also indicated some head scratching…there is always a way to see what the market is doing you just have to find it. By the way, Kudo’s to Asa and Phil for the great job they’ve been doing.
LikeLike
Morning quick…great chart above, hope it accurately portends the future…..and thank you for your kind words.
LikeLike
🙂
LikeLike
Good afternoon all. Currently, /ES is trading no mans land, in between a profit target of this long setup at 3012.81 and a 15 minute, 50% long at 2999.38. The corresponding 61.8% long is 2997.22. Bonds are trading a 50% long and /VX is in counter trend rally up to a 50% short. For these reasons, I would give a slight nod to the bears in the overnight session.
Want to make this clear, there is no current entry, long or short. Trading this algorithm…..one has to wait for. /ES to test the 50% long and it is defending…that is your entry or if the profit target is tested but doesn’t go through….then I would expect a minor pullback to the next 50% long entry……and that is your entry.
One last word re: my reply posts today…there is an art and a science to drawing up anchors. At times it straight forward. However, if you see a previous high or low that this algorithm has been trading off…BINGO…keep that setup on your screen as the algorithm maybe trading off that level. The algorithm can simply be ignoring a high or low secondary to a news announcement and the
Previous technical high or low is what this algorithm is trading off. I know I am confusing some, all I am saying is don’t be so rigid in selecting and keeping a set of anchors when /ES isn’t trading off that level. Experiment a bit, go to another level, high or low to see if the algorithm attached itself to that technical level. This is where IMHO, DH excels and one of the main reasons why I trade with his setups.
Bottom line 2997.22…bullish above and additional weakness to a lower support level below.
LikeLike
Travis..outstanding great to hear.
There is an updated bull bear line in the and for this mornings trading at /ES 2989.89 that just broke along with /YM and NQ. Would expect a CTR of about 6 point at any time, perhaps to test 2996/7…lets se what happens if we get there. However, the targets below for /ES is 2991.42 and todays gap.
LikeLike
BTW, there is a profit target of the 15 minute short at 2989.26 in addition to the two other targets outlined above.
LikeLike
…well the 6 point CTR came and went? /ES is starting to sell off a bit now. Don’t trust this as the CTR did break the short…sloppy trading? If it was sloppy trading the targets are 2990.75 a double bottom, 2988.33, a profit target and todays gap.
LikeLike
Hi Asa, I don’t follow this line of reasoning- maybe i am not understanding DH properly. The larger hourly short failed when 618 was closed above and broken. I would think anyone following retracements this AM should be looking for longs? If I look on the 15 min chart we have a series of traditional longs up from 69, the most recent of which is measured from 89 to the top. https://invst.ly/bdvd0 Now, in DH terms, this most recent long likely failed, but i see it the other way around. Bulls defended 93 and bears were trapped at false breakout to the downside.
LikeLike
Hi chrisk
From my morning post, there was a updated 61.8 short at 3002.87. /ES never traded to that level, only to 3001. From that high, /ES started to sell off, the decline broke a 15 minute long and sold off to 2990.75. From posts above, I was expecting a counter trend rally, CTR. The high anchor was todays high at 3001 and the low anchor was 2990.75. That that is why I ballparked up to a 6 points CTR to 2996.
That CTR actually exceeded the 61.8% SHORT at 2997.08…that’s when I opined, “sloppy trading” because it sold off from that break. /ES came back up for a second test and that CTR traded to the 61.8% SHORT at 2997.08 but did not break the short by 1 full tick. /ES is now selling off from that second test of the 61.8% short at 2997.08.
Targets below are unchanged from my posts above.
Hope tis helps.
LikeLike
Thanks, ASA.
I see your point.
Likewise, the 5MIN SMA (-) alignment went (+) at 2995.50 (12:45p ET).
That confirmed a potential bias to the upside, and as we see, prices zoomed past 2998 to 3006.
That crossover alignment could have whipped back below, so it’s not always valid, but IMO, once the 5MIN SMA aligns whichever direction (+) or (-), one needs to consider getting out of the position if opposite the alignment. (Or look for another entry point for one’s bias.)
Now, the 40SMA on the 5MIN is at 3001 at 3pm ET.
If the 10SMA crosses below the 40SMA, we go (-) again and prices below come into play.
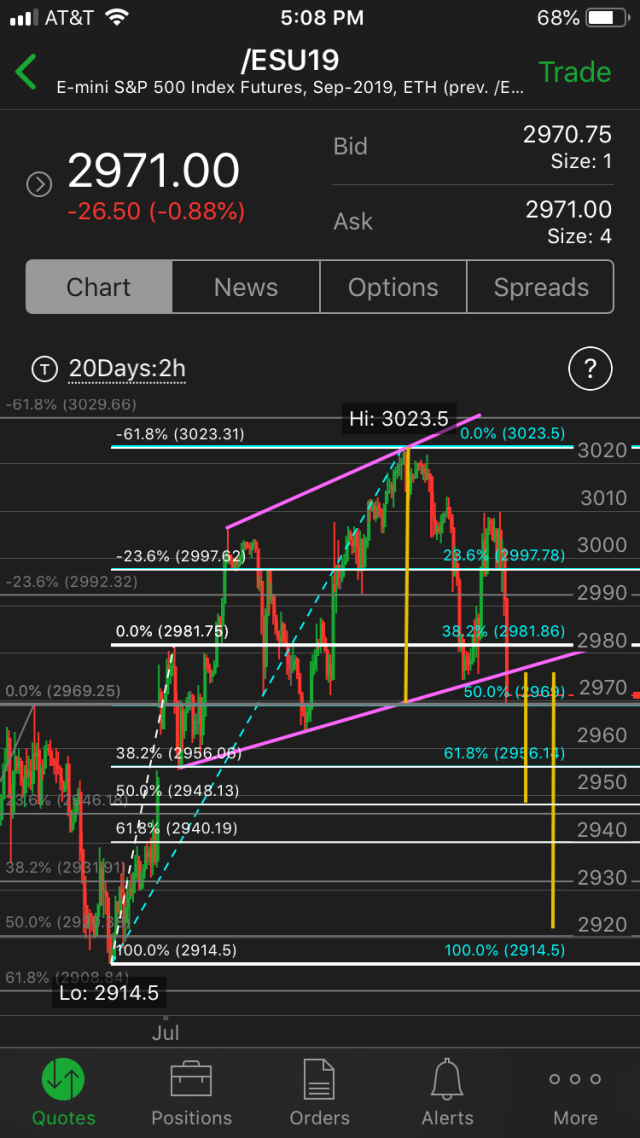
Likewise, given that prices haven’t exceeded the 78.6% retracement (@3011.94) of the entire move down to 2969.5 from 3023.5, downside is still possible.
As mentioned earlier, if we close above 3001, the 4HR SMA will align (+), so all intermediate timeframes will be (+).
[NOTE: The -23.1% extension at 3008.43 was reached (anchors 2969.5 – 3001). Usually a pullback to the 23.1% – 38.2% is likely before higher prices – DH’s measured move.]
LikeLike
All – wanted to reply and give our sincere thanks. I am a big believer in positive thoughts and prayer…”Ask and ye shall receive”. I saw the truck pass me in the ditch and called my wife in the car to hear her screams and I ran back on the interstate to find my family in the van. Nothing will ever prepare you for that, nor watching your child leave in a medivac. Humbling and awesome to read the 100s of texts, posts, messages over the past days. We got some rather dire reports Sat, but continuous improvement daily. Addie can move her legs now, the skull fracture seems to be minor enough and in a place to avoid brain surgery, able to speak now, the liver place turned out to be a fatty spot, and last night the blood clot just disappeared! That was the big item left. Months of rehab expected but really great news. She turns 8 on Friday. Thanks and be blessed! T
LikeLike
Travis, my thoughts are with you and your family! Speedy recovery for you daughter!
LikeLike
As a father of two girls I can’t and don’t want to imagine what you’re going through. God bless you and your family.
LikeLike
So glad to hear Travis. Thanks for the update.
LikeLike
😀
LikeLike
Travis
Bless your family….and may God speed their healing.
LikeLike
I’ve got 3 boys and 3 girls. What you’ve described is a nightmare for any parent. God Bless you and your family and I pray that God continues to work miracles of healing.
LikeLike
thank God travis
i use those 3 o clock prayers very sparingly
but this was absolutely the time to use it …
quick story …
my mother was a Eucharistic minister in the church
so my father could ask her to pray for anything for him
one day my father came to me and asked me to pray for him
i asked why are you asking me this ? mom is right there with you ?
he said … the Lord will listen to you
you only ask very seldom for anything from Him….
your mother is bothering Him every 5 minutes !
LikeLike
Thoughts and prayers to you and your family.
LikeLike
Looks like we are off to the races. 3018 5 waves down to 2973. Up to 3006 then 3 waves down to 2976. Overlap 3006. Correction is over and move higher into end of July. So appear we are going to open up around 2998 cash. See what happens
LikeLike
Hard to believe minute ii is finished. My indicator shows still going down on daily analysis and hourly appeared to reach top at 10 am ET. Sometimes takes awhile for Otis to get on the elevator before it goes down. I have a small short position but probably not making many trades before Fed announcement.
LikeLike
Bull anchors: 2969.5-3001
38.2% retrace: 2988.97 (potential bounce to 2996 first)
50% retrace: 2985.25
I say we bounce off 2989 and head higher.
30MIN SMA are (+).
1HR SMA are (+).
RSI for 5MIN is oversold
NOTE: We could continue lower as the bear move was not broken.
3001 is the 78.2% retracement of bear anchors: 3009.75 – 2965.50
Therefore, for this bull move to continue,
2981.53 (61.8%) or 2976.24 (78.6%) must not be broken. Your choice.
I say 2981.53 because the 1HR 40SMA is at 2987 area, so going down to 2981.53 and sustaining that price (no V bounce) would probably result in an SMA realignment to (-) for the 1HR.
LikeLike
In essence, the 1HR SMA show (+) alignment, so trend is UP.
Therefore, unless the fib retracement prices get breached and/or the 1HR SMA’s realign (-), prices can go down a little and then proceed higher.
Watch 2981.50, 2985.25 and 2988.97 price levels for potentially (+) reactions.
Why? The bias is UP.
LikeLike
Oh, yeah. Forgot (thanks, ASA, for your post below).
The bear move from 3023.5 to 2969.5 is the intermediate major move. DOWN.
The 68.2% level is 3002.87.
The 78.6% level is 3011.94.
Until the 78.6% is exceeded (3011.94), there is still a potential for a reversal to the downside (even if the 1HR and 4HR have (+) SMA alignments).
However, the SMA alignments show trend (or continuation of longterm, so one could trade bullish to that level from 2989 (if we get back there today) and wait and see, or take the SMA alignment (or 68.1% breach as gospel and hold the long position.
Of course, you could plot your extension fibs from the 2969.5 low and find a bull target to get out at. 3009 area?
LikeLike
Good morning T.A….n/p
LikeLike
Also, based on FIB retracements, for this bull move to confirm, 3001 (78.6%) must be taken out. I use 78.6% as my final stand. Others use 68.1%.
When 3001 is taken out (no inverse V move; sustained prices above), the 1HR and 4HR will both be in (+) SMA alignment.
Currently, only the 1HR is (+).
LikeLike
sorry, 2969.5 not 2965.5
*3009.75 – 2969.5
LikeLike
well at 3007 there is an over lap of 3006 and at 3008 that is the .786 retrace so over 3009 bulls win. at 3002. so 7 points. see what last 90 minutes has in store
LikeLike
Good morning all. Travis, my thoughts and prayers for your daughter and to your family….praying for a speedy recovery.
Not surprised by the overnight rally in /ES. Historically, equities are bullish going into a FOMC meeting where a rate cut is expected. Bonds and /VX, weakness, hinted at strength in equities in the overnight session.
DH has drawn up several long setups. Take notice of /ES 3002.87, this level is both a 61.8% short as well as a profit target of one of the long setups. I think this level will act as a magnet for /ES in this mornings trading…….and the final bull/bear level. Trade above this level and /ES, will trade to new higher highs. If /ES stays below 3002.87 the bears still have a shot (low probability).
Can’t r/o a quick trip to 2988.25, a 15 minute long, to re-fuel the rally, that can lead /ES to test the 61.8% short at 3,002.87.
Bottom line….3002.87 is the bull bear line in the sand.
LikeLike
thanks asa
LikeLike
Hi lunker…just posted a afternoon update …can you please release it.
Thanks.
Tony
LikeLike
Good afternoon all. A boring range bound day today. /ES tested the 50% short at 2989.63 and that level was defended to the tick and /ES declined off that level. Later on this afternoon, /ES tested both the 50% and the 61.8% short and those levels were defended. Bonds may not be offering any help to the equity bears and /VX is trading in no mans land, doing its own thing.
Because there was a 20 point ramp from the low, DH drew up a 15 minute long, as well as the larger short.
Bottom line…
1. for the bulls /ES has to break the 61.8% short at 2994.22. Targets are last weeks highs and a new all time higher high.
2. for the bears, /ES has to break the 15 minute, 61.8% long at 2977.14. If it breaks, /ES will test the overnight low at 2969.50. Below that level, is a very important 50% long at 2960.
LikeLike
We definitely got the bounce I was looking for this morning.
LikeLike
Looks like that finished the ‘abc’ retrace. Now we should drop.
LikeLike
Phil, are you following GBTC anymore. On the daily it looks like it is bouncing around the 38 special of the whole climb from February.
LikeLike
on bitcoin futures the .38 long and short are both at 9800
i am no longer interested unless above 14000
you could be riding it back down to zero
LikeLike
all you need is govmints saying its going to be outlawed
and you could be looking at a goose egg
LikeLike
Absolutely, China may be intervening soon enough and who know who will follow.
LikeLike
https://invst.ly/bdaxq waiting for hourly closes and P/A to see which scenario wins. Right now it looks better for the bears but i don’t trade that way
LikeLike
All, please don’t clog the board with responses but I do ask for a quick prayer for my daughter. We were involved in a terrible car accident Sat morning coming home from vacation when a tractor trailer failed to brake into stopped traffic on the interstate. Thank God he swerved but he destroyed the van and my oldest daughter (7) was airlifted to ICU with a fractured skull, severe brain trauma, and a blood clot. The 5 yo twins were unharmed. Doing better but will be a while. Appreciate positive thoughts and prayers. Travis
LikeLike
Sorry to hear this, wish you and your family well and wish your daughter a speedy recovery.
Praying from Luxembourg here.
LikeLike
wow, thats awful.Best wishes to you and your family. especially your daughter
LikeLike
You got it, buddy! She will be on my prayer list until I hear from you that all is well! God speed.
LikeLike
Prayers to you and your family.
LikeLike
You’ve got it, Travis.
LikeLike
Praying for you and your family.
LikeLike
I’m in. Prayers to your family and especially to your daughter.
LikeLike
so sorry to hear this travis
praying now but will be waiting for 3pm to pray again for you and your family ….
>>>>>>>>>>>>>>>>>>>>>>>>>>>>>>>>>>>>>>>>>>>>>>>>>>>>>>>>>>>>>>>>>>>>
At three o’clock, implore My mercy, especially for sinners; and, if only for a brief moment, immerse yourself in My Passion, particularly in My abandonment at the moment of agony. This is the hour of great mercy. In this hour, I will refuse nothing to the soul that makes a request of Me in virtue of My Passion
LikeLike
Travis I’m a Dad too and my heart sank reading this. I just sat here picturing everything and had a pit in my stomach. Please post updates whenever you would like. Best wishes for a speedy recovery!!!
LikeLike
Praying for you and yours, Travis.
LikeLike
Hello Travis, I am sure you have the best wishes and prayers of everyone here. Many of us are parents and can only imagine what you are experiencing. I am praying for your daughter’s health, and for all your family to have peace and confidence in her recovery. I know God wants her well. You may want to check this out:
https://www.awmi.net/video/series/healing-journeys/?id=LUIqSnAY
https://www.awmi.net/video/tv-archives/?yn=2014&wn=7&dn=1
I have first hand experience seeing this truth heal my wife, my friends, and many others. I hope you and your family find it helpful. Blessings… Greg.
LikeLike
Thoughts and prayers for your daughter and family. Stay strong Travis.
LikeLike
That’s terrible news, hope everything works out ok for her Travis
LikeLike
Good morning all. This mornings analysis is pretty straight forward. The anchors are Friday’s high and low. The 50% short is 2989.63. The corresponding 61.8% short is 2994.37.
Bottom line /ES 2994.37 bullish above and additional weakness to lower support levels below.
LikeLike
Yes, Phil, correct. I expect to trade hwb but saying that the fail point is at .618 $2842.
Disregard decimals, even crazier, Investing.com shows different highs depending on the chart pulled, so it’s just an approximate number.
I see now what you mean by 38% special, just could not figure it out from your chart.
You know what you are doing, actually much better than I do. I am way too slow when it comes to decision making 🙂
To sum up, I also am going to watch 38% special and 50% retracement, that’s where ES should end wave 2 of 3, otherwise it is ABC that started October (if remember correctly) of last year, which I don’t believe given the Fed turned dovish now.
I also want gold to correct and reverse to take out that big short you are showing. Then it could be huge 🙂
LikeLike
lol you couldnt see the fib for .38 retrace at 2912 on my chart kvilia
because its not there 🙂
people get confused if i put more than one on so i left that one off
LikeLike
Ha-ha, you got me there, Phil 🙂
Have a good rest of the weekend, buddy. We are cooking here in NY, though 😦
LikeLike
The problem is charts being considered without a time frame in mind. Even Phil’s charts (with all due respect, Phil 🙂 ) point only to a certain scenario, e.g. latest SPX chart shows bull above $2950 in reference to the extension. Well, If the extension fails, there is also hwb support for the whole 1 of 3 move with bull above $2942. Everyone needs to understand this differentiate the short term perspective and longer term trading setup. Examples below:

LikeLike
k
do you mean to say …….
.618 support at 2842
instead of
hwb support for the whole 1 of 3 move with bull above $2942. ?
if so i reference that by pointing out the 38 special of that fib which is 2912
LikeLike
you have it as 2911.39 … but i dont use decimals
within 1 full point is good enough for me
LikeLike
Phil, do you have a couple of sentences to describe your ’38 special’. I undestand it as a setup you feel gives you and edge. And roughly what I think its mechanics are.
LikeLike
slap
its just a 38% retrace .
…38 SPECIAL was one of my favorite bands
its important is because it shows you how aggressive the bulls are
if they are so eager to buy before it retraces to .5 or .618
it tells you they are afraid of missing out on the upside
LikeLike
i replied but dont see it yet
will reply again if it does not appear tomorrow
LikeLike
repost
38 special just means 38% retrace
it is the name of a rock band i liked
if the retrace is only to 38% before taking off to new highs
it tells me bulls are afraid of missing out and are very eager to buy
LikeLike
no problem
he flip flops all the time
its no big deal
he should just admit he is a day trader
and has no clue about the long term
LikeLike
edited
The Last post for a while, you may follow him on Twitter. Thx.
LikeLike
adios
LikeLike
es
nothing has changed for the last 2 weeks
you have been in a traditional long
the target at 3028 was nearly reached but no cigar
ergo risk continues to be to 2950 until 3028 is hit
cave man sez…
ending diagonal has broken the lower rail
and then rockets back up to kiss goodbye
if 2950 gives way look for 2912 ( 38 SPECIAL of last wave up )
LikeLike
Here’s my count and I’m sticking to my guns:
For those of you who don’t like trading on EW or wave counts, that’s fine. For me, personally, I like to count the waves – not because I’m so great at it but because when my count is wrong and the market shows me it’s wrong, it makes that very clear and I know immediately to get out. Otherwise, I might sit on that position and end up with a losing hand. This way, I know exactly when to stay and when to get out.
How much more of this drop I’m going to get to take advantage of…depends on how much more of it gets chewed up Sunday night. I agree with Lunker that we have a Head & shoulders pattern. They only pan out some percentage of the time but THIS time I thing this one is going to work. The projected path for that takes us to very near the .382 retrace. Specifically around 2915. I’m not saying it will stop there. I’m saying it will drop at least that far. Furthermore, I suspect we might get a bounce going into Monday morning. I’m guessing that might start around 2960. If so, above that would provide a nice entry point.
Good Luck All
LikeLike
chris
those who are following DH 15 min es are getting chopped up
you have to adapt it to the environment you are in which is now overlapping chop
first i go to 30 min and hourly bars
also i rely on cave man analysis more ie
simple breakdown and retest of support levels ( yellow lines )
also you have to watch SPX cash
more important than decimal levels on es is the
cave man picture now
when we have extensions …………DH is the only way to trade
now ….it doesnt work so well
adapt or die
LikeLike
Thanks Phil .👍
LikeLike
🙂
LikeLike
schizo ….
this is what i mean by cave man trading
simple reverse h and s breakout buy on SDS
unfortunately i got home too late to sell
so hope they blow it out to the downside for mon am … LOL
LikeLike
You are awesome phil, I actually went long on vxx and spxs .. on the break of 99 and 87 as you mentions , and sold vxx after market high ..and still keeping spxs
LikeLike
LikeLike
Yes, that’s why i don’t trade 15 min charts. Those fib pivots around 618s are death traps. My approach is to wait and be patient and try to observe what the market is telling us by relying on hourly closes and price action. It’s not what you do and does not really have anything to do with DH. Everyone has a path and this one’s mine 🙂
LikeLike
This is why i focus on hourly closes and bang the table on price action. observe the hourly spx relative to ES. On SPX, we opened above 618 at 3k, sucking in many bulls, and closed above it. However, where was the follow through? If one had simply waited to confirm the fib breakout via price action, they would have been spared the trap. https://invst.ly/bcebv
Looking at ES, the bullish view was trading the bounce off of .382 https://invst.ly/bcecr since the prior bearish retrace failed.
The wise course of action would have been to sell half the bullish position at the prior high and adjust the stop for the rest to B/E. In this case I did not sell half and got sucked in with the rest of the bulls when i saw the move in the cash market eclipse the 618. I didn’t lose but played this like an amateur and should have known better.
LikeLike
Based on your first chart, am I correct in saying you would use the 0.786 retrace as your breakout level? Do you use that level for confirmation of a rally only as in this case, or also for confirmation of a downtrend if that were to occur?
Thanks.
LikeLike
Hi James,
No, I don’t consider .786 at all. I am looking for a close above/below 618 and to confirm, we must trade above the high of the closing bar. Major caveat…I dont trade in a vaccum. I dont make buy or sell based on spx but its worth paying attention t what’s happening there.
LikeLike
agree chris
i dont just use DH especially in this chop
and dont religiously watch levels to the tick any more
cave man analysis is much more useful in this chop
LikeLike
LikeLike
Thanks guys!
LikeLike
Interesting factoid…
https://mobile.twitter.com/TihoBrkan/status/1152337816883474432/photo/1
LikeLike
25% will benefit markets, 50% will shock them. Most of the previous cuts took place at the higher rates.
LikeLike
Cr. to CBZ , see expanded Tweet.
LikeLike
anyone that posts here needs to be an open book. we are very fair and we share. we challenge for good reason. debate is positive but unfortunately you’re not him so you can’t comment
so follow his twitter
LikeLike
Holding short over the weekend, glad I didn’t listen to coolbiz’s flip flop this morning
LikeLike
Yeah he flip-flops a lot and there is negative value when he posts several hours after the fact that he flipped short when he was just pushing the bullish case. Tweets are real time but I never see any from him.
He might be the best trader in the world and a great Elliott waver but the tweeting after the fact isn’t cutting it so he ends up just being more noise.
LikeLike
lunker
cool biz / cj
should just admit he is a day trader ..and there would be no problem
his long term counts flip flop which is a BIG no no ….
you know even this CAVE MAN
has said BIG picture 3050 straight up since january
even tho i may flip flop daily and even intraday………..
i have no problem with cool biz daily flip flops
LikeLike
The problem is is that he is misleading. He shows his extremely high success rate trading and says there’s only one Elliott wave count. pounds the table about a certain direction bullish or bearish indicates he’s trading in that direction but then when he sees something different he doesn’t post until well after the fact. Similar to several other “successful” traders on blogs. so his information is definitely user beware.
LikeLike
phil you’re one of the few that live and post in realtime
LikeLike
just posted a chart and comment a few minutes ago
did the filter get it?
there was nothing controversial that i could see
LikeLike